 The Spreadsheet allows you to view statistical information for all issues in a family
at a glance. The Spreadsheet allows you to view statistical information for all issues in a family
at a glance.
A wide variety of column headings
are available. For more details on the many headings.
Click here.
The spreadsheet can be sorted by any column. This effectively ranks the issues by that
column's values. Just click in the column header
at the top of a column to sort. Clicking
a second time will reverse the order of the ranking, ascending/descending.
Right-click Menu
Saving a Spreadsheet
Save all columns the spreadsheet as a CSV file (use the savE as menu
item. This differs from saVe family as menu item which saves ONLY the ticker symbols.
CSV's store the column headers for the spreadsheet as well as the data.
Saving Column Headings
To saved the headings,
- Right-click and select "Clear List".
- Do Keep the column headings (YES).
- Right-click the spreadsheet. Select "savE as".
- Save the spreadsheet header in:
\FT4WIN\SPREADSHEETS\USERDEF\DEFAULT.CSV
Upon startup, FT4WEB will load this file and
display its
headers.
Alternately, save or load any spreadsheet. On restart, the
header, as shown when FT4WEB was shut down, will
be loaded (but not its data).
Adding Columns to the Spreadsheet
Click here for details.
Renaming / Editing Column Headers
Why would I want to rename a column?
- if you change a date listed in the column heading then the
values in that column will use the edited date when you click
recompute.
- if you save the headers or a spreadsheet with a renamed column,
AND the keyword in that column (like "Return") is changed, then that
spreadsheet can be reloaded with that renamed column intact. FT4Web
does not change columns when the header keyword not recognized.
Right click on the column to be renamed and select "rename".
Note: If you use the repeating columns (Weekly, Monthly, etc) the
dates used will be the dates you edited. These dates can be any dates.
In other words, editing a "Weekly" column header to contain 1/1/1990 -
1/07/2000 will cause a computation for a span of 10 years + one
week .
Resizing Columns
To change the width look for the splitter when moving the mouse pointer across the header. Even if it doesn't
appear, click and hold on a vertical column border and drag to change the column's width. The width will be
remembered from session to session. The width may be different for each column type like Beta, MaxDraw, etc.
If the fonts are changed, the width will have to be reset.
To Sort and Rank the Issues in Ascending or Descending Order According to any of the Columns.
Click any column header. The spreadsheet will alternate between ascending and
descending sorting with each click.
Printing the Spreadsheet
Use the right-click Print menu item. See Issue
List Printing.
To Chart an Issue
C1ick-and-hold its symbol and drag it the ColorBar.
To Move the Current Spreadsheet List to Other Tabs
Click and hold the Issue List name field until the  appears, then drag and drop on the desired tab. appears, then drag and drop on the desired tab.
Using Excel with FT Data
When displaying week, month, quarter, or annual data on the Spreadsheet,
the data is listed with the most recent period first. This makes it convenient
to view the most recent data which is, generally, the most important. However,
viewing this spreadsheet in Excel and creating a chart will produce a disconcerting
reversal of the X-axis and poor chart labels.
Instead, use the spreadsheet export. The order of the export and the chart
labels is ideal for Excel charting..
Nonetheless, if you want to use the visible spreadsheet for whatever
reason. In Excel, be sure the x axis is visible, then select it, the use the
Format option. You can reverse the plotting order of categories or values for
most charts, as well as of data series for 3-D charts with a third axis. You
cannot reverse the plotting order of values in a radar chart.
- Click the axis for the categories, values, or series whose plotting
order you want to change.
- On the Format menu, click Selected Axis, and then click
the Scale tab.
- To reverse the plotting order of categories, select the Categories in
reverse order check box.
- To reverse the plotting order of values, select the Values in reverse
order check box.
- To reverse the plotting order of series for 3-D charts, select the Series
in reverse order check box.
|
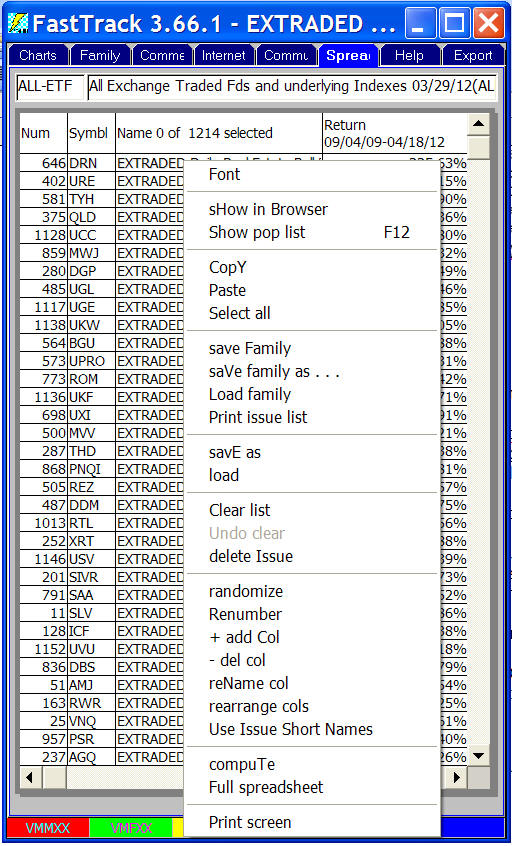
 Del Issue - Deletes all highlighted issues. You may also hit
<Del> to perform the same action.
Del Issue - Deletes all highlighted issues. You may also hit
<Del> to perform the same action.