FT4Web by Investors FastTrack |
Adjusted Return Charts (J and 2)
Adjusted Return (J and 2 charts) are NOT indicators. They show the results of trading signals generated by the indicator (tic) above the J or 2 Chart. They do not create buy/sell signals and there are no parameters to set. These charts show the results of switching between issues based on signals immediately above the 2 Chart. The red green trading result can be saved as for later analysis. |
|
The J and 2 Charts
In this chart a 10-day moving average is used to trade a junk bond fund to money market. Note: Most junk bond funds do not allow the 20 trades/year that this strategy requires. Why use these Charts?The Adjusted return charts make it easy to review the success of a trading strategy. When used with the funds and a single day delay, the charts show exactly what a real investor would make. The J Chart is used in selection strategies in which the assets stay fully invested in the lines visible on the T Chart. The 2 Chart is commonly used in market timing. When the 2MM is set to a money market fund like VMFXX, then the green segments show the periods out of the market (i.e. in money market). |
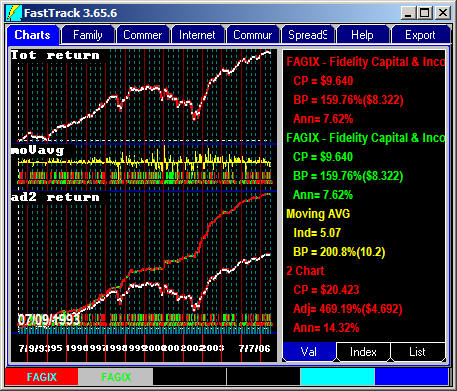 |
Small Cap to Large Cap
|
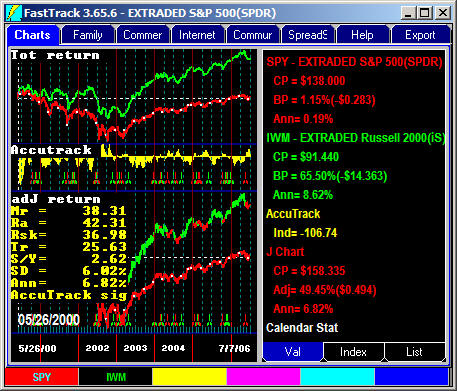 |
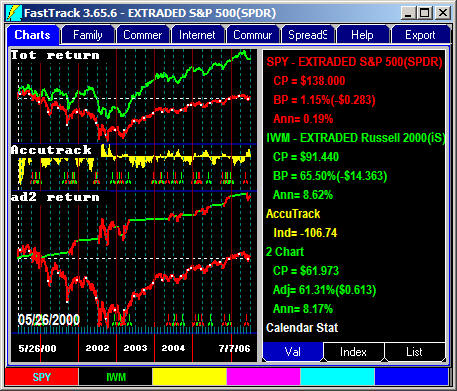
Timing Using the 2 ChartThe 2 chart is usually used for timing, not selection. The 2 Chart's multi-color line is a composite of the returns of the red and an unseen 2MM issue, usually a money market fund. The 2MM issue may be changed by right-clicking the chart name and clicking on "Settings" to open the Parameters dialog box. The green segments of the 2 charts composite come from the 2MM issue and NOT the green line displayed. In this case VMFXX is the unseen money market fund used. If your use of FastTrack is limited to timing switches between a single fund and money market, then you will not likely beat buy-and-hold over the long-term (but you will decrease risk). |
 |
Reversing the SignalsThe impact of the red and green signals can be exactly reversed by right-clicking the Chart ToolBar and selecting Signal/Reverse. Use this technique to trade a trendless issue stuck in a trading range as Microsoft was from much of 1999 -2004. Moving averages may be interpreted in reverse to produce low risk returns during such periods. In this case a 10-day moving average we used with a 10-day trading delay. There were only
2.72 trades per year and a 51% loss was converted to a 45.5% gain This is still pure timing. Don't expect every tech stock to do well using this strategy. Selection, as discussed throughout this help, always works better than timing. | 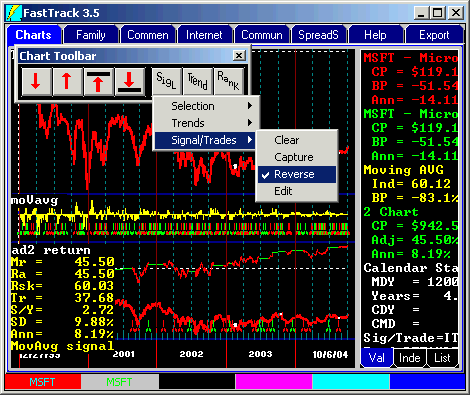 |
Using More than the Red and Green linesBy setting multi-colored signals, FT4WEB can display the return of a complex set of trades on a J Chart. The J Charts composite line is drawn multi-colored corresponding to the tic colors in the T or P charts. The computation considers that 100% of the assets are switched at each tic. J Chart Reversal Note: If you select signal reversal by right-clicking the Chart Tools ToolBar, the red tics evoke the return of the green line while all other color lines evoke the return of the red line. 2 Chart Reversal Note: The red tics evoke the green line's return. All other tics evoke the red line's return. | 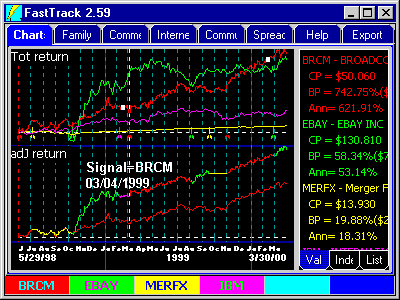
|
Limitations of the J ChartTrading between market segments works best when the segments have different price movement characteristics (relatively low correlation as measured by Cor=). To use the J Chart to trade between two carefully selected issues, try the AccuTrack relative strength trading. (The A chart)
|
Saving the data in a J or 2 Chart's Multicolor Composite Line
Why save the J or 32 Chart composite line?
Note: For easy export to Excel.
Key Words: Excel, FNU, Export |