|
Since standard deviation is a measure of volatility, the bands are self-adjusting, widening during volatile markets and contracting during calmer periods. In this chart the red line has pretty constant volatility. Crossing the lowest cyan line would be a clear SELL. Disclaimer: No technical indicator can assure profits. As market conditions change, the interpretation and use of the indicator must change. |
| Interpreting Bollinger Bands?
Bollinger purple upper and cyan lower bands provide a trading range for the red line price. The spacing between the bands is based on the volatility of the prices.
The creator, John Bollinger, notes:
However, with mutual funds that are not as volatile as the options and stocks the Bollinger was designed to trade. A second indicator is required to signal that a moderate resumption of the prior strong Bollinger signal is reasserting itself. In the chart below, the Stochastic remain above it's center line indicating that the uptrend persists. Bollinger will not give another BUY until it reaches an extremely good buy when crossing the lower Cyan bound. The 3/15/2020 Bollinger sale was perfect. Then, Stochastics gave a clear indication that despite the plunge, that the uptrend was continuing. Today the Bollinger has recovered and can give me another quick exit signal. Stochastics shows the first sign that it is resuming its highly volatile pattern going back to 2016. The chart includes the VFINX green line simply as a visual indication of the lack of volatility in IOFIX. It does not participate in the timing of Bollinger.
|
For more info on the Mathematical Computation: Bollinger Band EquationParametersBollinger Bands have two adjustable parameters, P (period of the Exponential Moving Average) and D (the number of Standard Deviations to shift the upper and lower bands). Bollinger recommends using 20 for the number of periods in the moving average and using 2 standard deviations. He also notes that moving averages of less than 10 do not work very well.P governs the smoothing of the center line. D controls the width of the upper and lower bands. Narrower bands produce more signals. |
 Bollinger Bands are upper and lower "envelope" lines plotted at standard deviation levels above and below a moving average.
They predict the trading range of the red line.
Bollinger Bands are upper and lower "envelope" lines plotted at standard deviation levels above and below a moving average.
They predict the trading range of the red line.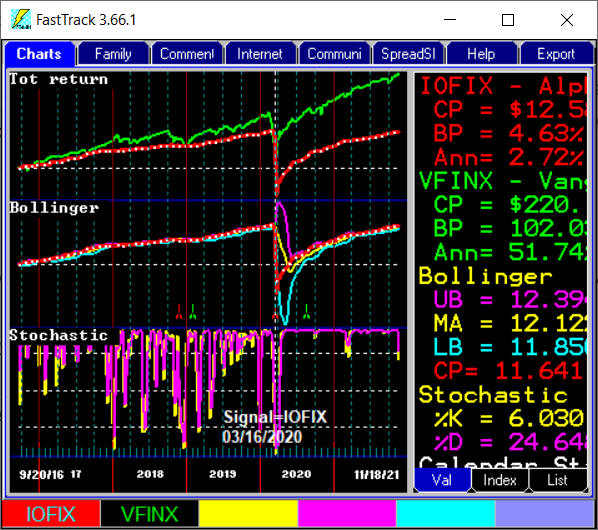
 |
| The above
graphic shows the FastTrack Bollinger chart (B Chart) compared to the
MetaStock Bollinger chart. The Upper Band line and its performance value (UB= in purple) on the FastTrack
screen agrees with the second red number on the MetaStock screen. The
Lower Band and its performance value (LB= in cyan) agrees with the bottom red number on the MetaStock
chart. (The yellow line midway between the upper and lower band is not present in this FastTrack illustration). Notes: FastTrack prices are shown using adjusted closing prices. If you produce the same charts above on MetaStock ver 6.0-11.0 and FastTrack today, you will find that the UB=, LB=. and CP= values will not be the same. MSFT has paid dividends affecting the historical red line prices. Of course, if the MetaStock data has been exported from FT, and thus is properly dividend-adjusted, the MetaStock and FastTrack values will continue to agree |
|
 Signals