Last edited
03/11/14
FTAlpha - FastTrack Alpha
FTAlpha is a selection method that combines return, risk, and correlation into a single
indicator value.
- FTAlpha encompasses
the concepts of Modern Portfolio Theory, MPT.
- FTAlpha diversifies your portfolio to
provide risk reduction while shifting the portfolio to top performers.
- FTAlpha generally works best when selecting from a universe of 40-50 mutual funds and exchange traded funds (ETFs), but will also work within
a portfolio holding dozens of large cap stocks from a universe of hundreds of stocks.
- FTAlpha is usually used in Momentum
Models. However, even when using Momentum, FTAlpha effectively acts as a Value model during
periods when your portfolio loses money. Click for
details.
Click for an example of
FTAlpha Momentum trading.
Interpreting FTAlpha on the Spreadsheet Tab
Assuming that your portfolio is adequately represented by the
low risk basis line (see
Mimicking below), then ranking of any family of funds or stocks
by the
FTAlpha
column will separate those issues into three groups:
- Positive FTAlpha. These issues added to your portfolio should reduce
risk and increase return.
- Near zero value FTAlpha: Changing positions in these issues will not improve the risk/return of
your portfolio except to the extent that you sell and use assets to purchase higher ranked
issues.
- Negative FTAlpha: These issues when removed from your portfolio should reduce risk and
improve returns.
FT4Web does not give you a canned way to build an exact portfolio line, but
"exact" is not necessary and may even be undesirable.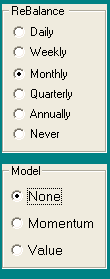
- If a single issue accounts for 40% or more of assets, just
put that fund in the green ColorBar cell.
- If you hold 10 or more mutual funds, then
likely your current portfolio resembles the S&P 500. Put
VFINX in the green ColorBar cell.
- If you hold, for example, 5 funds with
each being in excess of 10%, then put all funds in the Chart Tab's issue
list. Set the Appearance dialog
settings to Rebalance=Monthly Strategy=None. Set the green ColorBar cell
to AVG.
- If most of your assets are in a few stocks, and you
trade regularly each week,
then FTAlpha will not be of any help.
- Set the the low risk basis 'green Line'.
There is no magic in creating this green line. The line needs to only
approximate your holdings.
Starting the Momentum Modeling
- For any period, the lowest ranked FTAlpha issues are sold until 25% of assets are in cash.
- The assets are used to buy equal dollar amounts of the top 10% of issues based on the
FTAlpha score. For example for a family of 40 issues, assets would be
divided evenly among the top
4 issues.
Note: if you mimicked your portfolio as suggested above but
actually the portfolio is,
- 60% in Fund X,
- and if the model suggests adding more Fund X,
- then, do not add more Fund X.
- Allocate assets to other high ranked funds.
Using the Spreadsheet to
Make Trades
If you are trading monthly, then after updating
on the 31st, you would follow the instructions below, and place trades for
execution on the close of the next trading day.
- Load family that represent your holdings.
See Mimicking Portfolio above. Compute a Monthly Rebalanced None Model AVG in the green line .
- Set the Low Risk Basis
to the green line.
- View the Charts. Set the Dashed Pole a
month back.
- Go to the spreadsheet and add an FTAlpha column
and a COR column.
- On the Chart Tab load a diversified family
from which you will choose your trades. It should always include funds that
you are currently holding
- Hit the K key to rank the family
- Sort the Spreadsheet by the FTAlpha column (click the top of the column)
- Now you are ready to place trades with your broker. Remove or
reduce the low ranked funds in your portfolio. Add the high ranked funds.
FT4Web's Model trades 25% of assets each period, but you can vary that. If you trade too much of your portfolio, then you will lose the
diversification which is essential. FTAlpha tells you what to add to complement your existing
holdings, but if you trade 75% of assets each period, then there will be nothing left for the new
holdings to complement.
You don't HAVE to use the same diversified
family every period. We DO
recommend that you change the family regularly to add new interesting diverse funds.
Weekly and Annual FTAlpha rankings rarely produce desired results. Monthly
and Quarterly rankings work better.
Interpretation #1: Building a Portfolio
- Adding issues to your portfolio with high positive FTAlpha Values will improve performance and
decrease volatility of your portfolio.
- Adding issues with positive FTAlpha and high correlation will improve
portfolio performance, but with increased volatility.
- Adding Issues with Low FTAlpha will hurt portfolio return
without reducing risk.
- Adding Issues with Low FTAlpha and low Correlation will hurt return, but
may substantially reduce risk. Bear funds often fall into this category.
Interpretation #2: Managing a Portfolio
- Increase your position in issues with high FTAlpha and low correlation.
This will reduce volatility and increase return.
- Increase your position in specific issues which have positive FTAlpha. This will increase return and reduce risk.
- Increase your positions in issues with neutral FTAlpha (hovering
around zero) and low Cor=. Reduce positions in issues with neutral FTAlpha and high Cor=. This will reduce volatility without hurting
return.
- Reduce holdings in issues with negative FTAlpha.
- Consolidate holdings with neutral FTAlpha and high
Cor=
- Review issues with negative FTAlpha and low Cor=. These may
be providing a comforting hedge (volatility reduction). Consider moving
some assets to money market to achieve the same result.
- During periods when the momentum strategy is
failing (the Low Risk Basis or the Momentum AVG line has a negative return
for the period), then FTAlpha will effectively become a value model:
Take profits on the winners and invest in the
losers. This can be disconcerting.
Restated: When Momentum strategy is failing, then the Value Strategy is
likely winning. Taking profits on your winners and investing the proceeds in
issues that have already fallen is a reasonable, time-honored strategy.
LIMITATIONS:
Ideally, members of your family would be issues that
have about the same Standard Deviation( SD= ). If your family contains funds that range from a SD of 1 to 18, then FTAlpha trading will focus on the extreme members and ignore the members in
the middle range of volatility. Your results will be poor.
If your family only has 3-5 members, then FTAlpha will pretty much hold
all of them in roughly equal portions most of the time. As one member
becomes over weighted, it becomes highly correlated with the portfolio and
FTApha down rates it to a sell. Ideally, you should trade from a diverse
family of 10-100 members.
As with most technical analysis, funds are
easier to analyze than stocks. Funds, including sector funds, will be more
likely to continue their past volatility and correlation with respect other
funds . . . stocks are much less likely to continue their trends.
However, FTAlpha trading does work, but you have to hold 10-20 stocks to
achieve risk-adjusted returns approaching a Momentum Model holding 3-6
funds.
|
| |