-
The New York Board of Trade, exclusive futures and options exchange for the Reuters CRB
Index, will introduce new contracts on a revised and renamed version of this leading
benchmark of the commodity futures market beginning July 11, 2005.
The renamed Index � the Reuters/Jefferies CRB Index � is the collaborative effort of
Reuters, the global information company, and Jefferies Financial Products, LLC, a
leading provider of commodity-related products for institutional investors and a
subsidiary of Jefferies Group, Inc. On June 20, 2005 , the Index will officially become
the �RJ/CRB�, undergoing the most significant revision in its nearly fifty year history
with changes in weighting, methodology and commodity representation.
Developed in 1957, the Reuters/Jefferies CRB Index is one of the most often cited
indicators of overall commodity prices. Originally, the CRB Index was weighted heavily
towards agricultural commodities. Since its inception, it has been revised nine times to
be more representative of a broader range of commodity prices, particularly energy. This
tenth change brings the Reuters/Jefferies CRB in line with the evolution of a rapidly
expanding commodity futures market. The RJ/CRB Index continues to offer investors a
broad and reliable benchmark for the performance of the commodity sector; it now
represents nineteen commodity futures markets, including all five of the NYBOT primary
agricultural products (cocoa, coffee, cotton, FCOJ and sugar).
�The transition to the Reuters/Jefferies CRB Index comes at a significant time for
the futures industry,� stated NYBOT President and CEO C. Harry Falk. �Many portfolio
managers and individual investors are turning to commodities as an important alternative
asset class that may provide critical portfolio diversification, and the RJ/CRB market
at the New York Board of Trade offers serious investors access to the commodities market
though a single financial instrument with less volatility than generally found in many
individual commodities.�
New York �s original futures exchange began trading the CRB in its index marketplace
in 1986; the name of the index changed to the Reuters CRB Index in 2001. Now again
renamed as the Reuters/Jefferies CRB Index, these contracts offer investors direct
access to an asset class that may diversify their holdings, improve portfolio returns,
reduce overall portfolio risk and hedge against inflation.
Trading in the RJ/CRB will commence on July 11, with the first listed month of
September 2005. Effective with this introduction, the RJ/CRB futures will list four
months on a quarterly cycle (March, June, September and December). The RJ/CRB contract
will also feature a multiplier of $200 times the Index (down from $500 in the old CRB).
The new contract size will provide easier access to the Index market. Real time data for
the RJ/CRB will be generally available beginning June 20 th under the current CRB
trading symbols.
The previous version of the Reuters CRB will be renamed the �Continuous Commodity
Index� and will be made available for trading under the symbol �CI� after the close of
business on June 17th. All outstanding open positions in the current Index will be
rolled into the new product and trade under the symbol �CR�. The Exchange will continue
to list new months for the CCI.
-
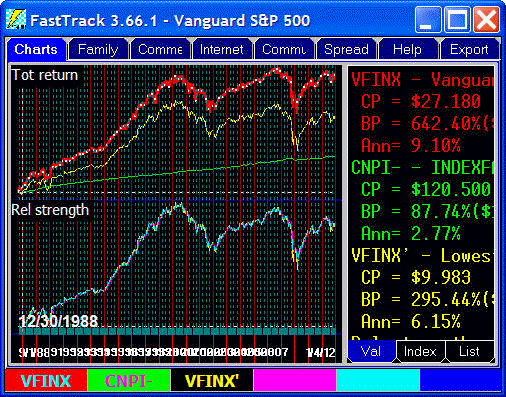
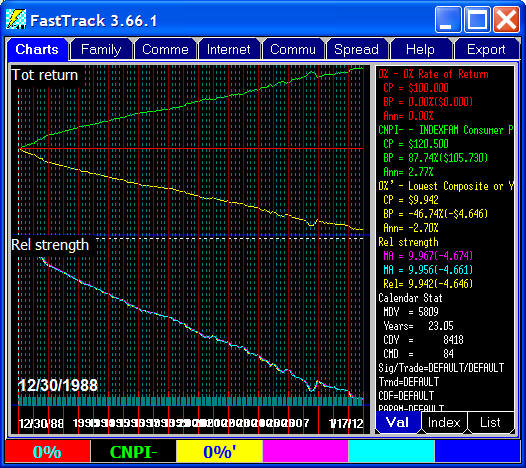
CRB-1 Reuters CRB Total Return Index
For FastTrackers the CRBI- and CRB-1 offer the opptunity for generating
simple relative strength signals. Using CRBI- in red and CRB-1 in green,
AccuTrack 25/100 creates signals which have a successful timing record. This
is by no means optimal. However, the strategy suggests potential for using
these signals to trade short/long commodity funds to diversity a portfolio.
http://www.crbtrader.com/crbindex/total_return.asp
"The Reuters-CRB-Tot Return Index's (CRB-1) return and volatility
characteristics allow it to serve as an benchmark for institutions looking to take advantage of
this asset class.
One of the key features of the CRB-1 is its method of calculation. Because the CRB-1 is
geometrically averaged, the listed CRB-1 future contracts almost always trade at a discount to
their fair value. This is due to the fact that arbitrageurs are able to manage a short CRB-1
futures position against an equal weighted long component position which is arithmetically
weighted. As time passes and depending upon the volatility of the component commodities, the
arbitrageurs long component position will outperform the short CRB-1 position. This mathematical
certainty allows the arbitrageurs to sell CRB-1 futures contracts at a slight discount to their
daily calculated value. Informed investors may regularly obtain this price anomaly and therefore
increase their overall return by the level of the discount captured. A large institutional
investor may find this aspect of using the CRB-1 particularly attractive. Along with the size of
a CRB-1 futures contract ($100,000 per contract with the index at 200.00), using CRB-1 futures
contracts may seem the most useful of the current commodity benchmarks currently available.
Many investors looking to commodities as a hedge against other held assets are not so much
concerned with commodity prices rising but with commodities prices rising quickly. Large
upward spikes in commodity prices may send investors scrambling to insulate their portfolio
against the possible inflationary ramifications associated with such a move. The comparatively
low volatility of the CRB-1 make using CRB-1 options a reasonably priced insurance policy.
"
For every exchange traded fund there is an index. These are members of
the FastTrack ETFIndex family. Trades in the ETFs during the trading
day occur above
and below the most recent index number typically taking place with 0.1%
-.25% of the index. Strategy: The index-ETF spread is always
most narrow at the close of the market which, not coincidentally, is the
only time at which the exchanges are required report trading spread. End of
Day trades are usually batched together and executed 15-minutes after the
close of the US markets. When buys and sells are in balance the average
closing trade is very, very close to the index close.
Major organizations like Dow Jones and Barclay's Bank have
longstanding indexes and create new indexes regularly in hopes of attracting
license fees from organizations who wish to create new ETFs based on the
indexes. Often, but not always, when a new ETF begins to trade, the index
organization will publish a new version of the index with a different ticker
symbol to underlay the ETF. Often a longstanding index has been (and will
continue to be) be computed or managed in way that is difficult for a funds
manager to follow. The new equivalent ETF index, using a different set of
construction rules, is intended to be easier to manage.
This new index ticker and associated data will coexist with the old
index ticker
symbol both often having the same name and essentially the same performance.
FastTrack often carries both of these indexes and the longstanding index
will have much more data and be more widely recognized.
Federal Reserve
These indexes and many more will be added to the IndexFam by 11/5/2018
See the online discussion of each of these indexes
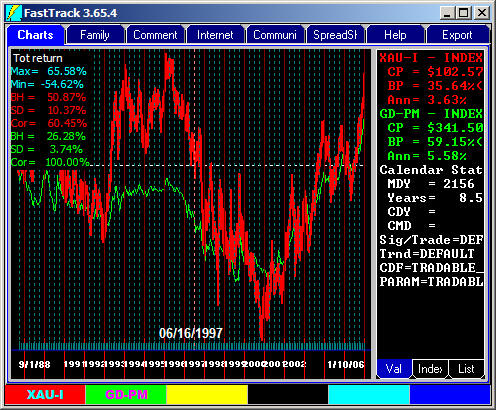
The majority of gold by weight is sold in the London markets at the morning and afternoon
gold fix price - one price for all trades. These are the prices we quote in GD-AM and GD-PM.
This means that NY prices can differ (as they do in the 13 cities worldwide that trade
gold). In the US Handy Harmon Index (Bridgeport CT) , is commonly used. The HH price adjusts to
the London Afternoon gold fix and then can drift from that point later in the NY trading day.
One issue created by our use of the London pricing is that London trading is closed for
different holidays. Where we do not get
a London price for a US market day, then FastTrack's GD-PM will be adjusted to match the HH
price quoted in the Wall Street Journal. Commonly, the quoted HH Price is the same as the
London PM fix, but not always.
XAU-I is an index of gold stocks. This index is often used as a basis for trading of
derivatives (options and futures). Gold stocks are more volatile than the price of gold, and
generally move in the same direction as the underlying price of gold. A small increase in gold
price can result in the doubling of profits in the gold stocks.
LIBOR licensed from Intercontinental Exchange is a
benchmark rate the world's leading banks use to charge each other and
to base interest rates for consumers..
LIBOR Indexes
BL12-
EL12-
ZL12-
UL12-
BL1-
EL1-
ZL1-
UL1-
BL1W-
EL1W-
UL1W-
BL2-
EL2-
ZL2-
UL2-
BL3-
EL3-
ZL3-
UL3-
BL6-
EL6-
ZL6-
UL6-
|
12-M LIBOR-British Pound
12-M LIBOR-Euro
12-M LIBOR-Swiss Franc
12-M LIBOR-US Dollar
1-M LIBOR-British Pound
1-M LIBOR-Euro
1-M LIBOR-Swiss Franc
1-M LIBOR-US Dollar
1-W LIBOR-British Pound
1-W LIBOR-Euro
1-W LIBOR-US Dollar
2-M LIBOR-British Pound
2-M LIBOR-Euro
2-M LIBOR-Swiss Franc
2-M LIBOR-US Dollar
3-M LIBOR-British Pound
3-M LIBOR-Euro
3-M LIBOR-Swiss Franc
3-M LIBOR-US Dollar
6-M LIBOR-British Pound
6-M LIBOR-Euro
6-M LIBOR-Swiss Franc
6-M LIBOR-US Dollar
|
See details at
https://www.investopedia.com/terms/l/libor.aspand
inflation |
Bank of America Bond indexes
Licensed from Intercontinental Exchange
E3CE-
E3C6-
E3C-
E3CT-
M9TR-
M5TR-
MFTR-
M6TR-
M7TR-
M1TR-
M2TR-
M3TR-
M4TR-
MMTR-
M9EY-
M9OA-
M96Y-
M5EY-
M5OA-
M56Y-
MFEY-
MFOA-
MF6Y-
M6EY-
M6OA-
M66Y-
M7EY-
M7OA-
M76Y-
M8EY-
M8OA-
M86Y-
M8TR-
M1EY-
M1OA-
M16Y-
M2EY-
M2OA-
M26Y-
M3EY-
M3OA-
M36Y-
M4EY-
M4OA-
M46Y-
MMEY-
MMOA-
MM6Y-
|
BofAML AAA-A Emerging Markets Corporate
BofAML AAA-A Emerging Markets Corporate
BofAML AAA-A Emerging Markets Corporate
BofAML AAA-A Emerging Markets Corporate
BofAML US Corp 10-15yr Total Return Inde
BofAML US Corp 1-3yr Total Return Index
BofAML US Corp 15yr Total Return Index V
BofAML US Corp 3-5yr Total Return Index
BofAML US Corp 5-7yr Total Return Index
BofAML US Corp A Total Return Index Valu
BofAML US Corp AA Total Return Index Val
BofAML US Corp AAA Total Return Index Va
BofAML US Corp BBB Total Return Index Va
BofAML US Corp Master Total Return Index
BofAML US Corporate 10-15 Year Effective
BofAML US Corporate 10-15 Year Option-Ad
BofAML US Corporate 10-15 Year Semi-Annu
BofAML US Corporate 1-3 Year Effective Y
BofAML US Corporate 1-3 Year Option-Adju
BofAML US Corporate 1-3 Year Semi-Annual
BofAML US Corporate 15 Year Effective Yi
BofAML US Corporate 15 Year Option-Adjus
BofAML US Corporate 15 Year Semi-Annual
BofAML US Corporate 3-5 Year Effective Y
BofAML US Corporate 3-5 Year Option-Adju
BofAML US Corporate 3-5 Year Semi-Annual
BofAML US Corporate 5-7 Year Effective Y
BofAML US Corporate 5-7 Year Option-Adju
BofAML US Corporate 5-7 Year Semi-Annual
BofAML US Corporate 7-10 Year Effective
BofAML US Corporate 7-10 Year Option-Adj
BofAML US Corporate 7-10 Year Semi-Annua
BofAML US Corporate 7-10yr Total Return
BofAML US Corporate A Effective Yield
BofAML US Corporate A Option-Adjusted Sp
BofAML US Corporate A Semi-Annual Yield
BofAML US Corporate AA Effective Yield
BofAML US Corporate AA Option-Adjusted S
BofAML US Corporate AA Semi-Annual Yield
BofAML US Corporate AAA Effective Yield
BofAML US Corporate AAA Option-Adjusted
BofAML US Corporate AAA Semi-Annual Yiel
BofAML US Corporate BBB Effective Yield
BofAML US Corporate BBB Option-Adjusted
BofAML US Corporate BBB Semi-Annual Yiel
BofAML US Corporate Master Effective Yie
BofAML US Corporate Master Option-Adjust
BofAML US Corporate Master Semi-Annual Y
|
The purple is is a dividend adjusted line. The other lines are yield
rates For details see
https://fred.stlouisfed.org/categories/32413 |
|
https://fred.stlouisfed.org/categories/32413 |
VT10-CBOE 10-Year Treasury Note
Volati
VBR- CBOE Brazil ETF Volatility Index
VCN- CBOE China ETF Volatility Index
VCO- CBOE Crude Oil ETF Volatility Ind
VDJ- CBOE DJIA Volatility Index
VEM- CBOE Emerging Markets ETF Volatil
VE- CBOE Energy Sector ETF Volatility
XEC- CBOE EuroCurrency ETF Volatility
XG- CBOE Gold ETF Volatility Index
VGM- CBOE Gold Miners ETF Volatility I
VN100 CBOE NASDAQ 100 Volatility Index
VR2K-CBOE Russell 2000 Volatility Inde
VXO- CBOE S&P 100 Volatility Index: VX
VSP3-CBOE S&P 500 3-Month Volatility I
VAG- CBOE Silver ETF Volatility Index
VIX- CBOE Volatility Index: VIX
Moody's Bond Indexes
The Moody's bond index series available to us is listed below.
We license these these indexes using the ticker symbols shown. The indexes which
are not in FT DT DB as of August 2009 are included in this listing to give
you a better idea of the components of each index. No further explanation of
index components is available. We will add additional on request
-
MD-09 MOODY'S BOND YIELD AVG AAA RATED CORP
-
MD-16 MOODY'S BOND YIELD AVG COMP CORP
-
MD-18 MOODY'S BOND YIELD AVG COMP PUB UTIL
-
MD-21 MOODY's BOND YIELD US GOV 6-MO SECUR
Under Construction |
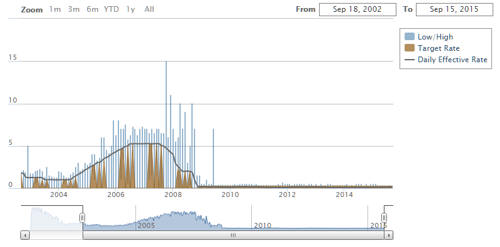 Federal
Funds Target Rate
Federal
Funds Target Rate