Trend Lines
Updated
04/17/14
FastTrack for the Web allows you to draw multiple trend lines.
When you can draw a trend, then the issue is "trending".
While an Issue is trending, you should use trend-following
indicators, not trading-range indicators.
A neat aspect of FastTrack's trends is that you can, for example, draw the trend on an AVG of
a family of funds or stocks, and then step through the members of the family to determine
which are ahead or behind in the current move. The trend will automatically adjust itself to whatever red line is currently drawn.
Basics
- Trends are drawn on the red line of the T or P Charts.
If other color lines are on
the chart, they will be ignored. trends are relevant ONLY to the red line.
- You may draw up to 20 trends on a screen.
- A trend line has four points as shown below. Four clicks at the numbered
points below define the trend. Points 1 and 4 set the trend start and end points . These points do not
need to touch the red line. Points 2 and 3 set the slope of the trend and MUST touch
the red line.
- You may save trends and reload them as you wish.
Step by Step
Click on the "Trend" button on the Chart Tools Toolbar.
- Click a left starting point for the trend line somewhere on the Charts.
- Move to a bottom and click.
- Move to the next bottom and click.
- Move to the end of the trend and click.
Warning: Backing up over any a click will
undo that click. If the click is in the right place, then move to the right
and do the next click. If the click was on the wrong day, backup over that
click to reset it.
Helpful Hint:
When drawing an Uptrend, Points 2 and 3 should touch the lowest point on the
line segment. To find the lowest point easily, hold down the <Control> key as
you move the pole. The pole will stop in the lowest point of the red line that
it has passed over. <Control> + <Shift> while moving the pole to finds the high
point. Warning: Some keyboards do not properly interpret the combination
of <control><shift>. Be sure you are using the right mouse driver
 Optional: Right-click the Chart Tab Toolbar and select Trend extend to
make all trend lines extend to the most recent date charted. Optional: Right-click the Chart Tab Toolbar and select Trend extend to
make all trend lines extend to the most recent date charted. |
The Trend Line Label
Once drawn, the trend will display a percentage at the top. This trend label shows the percentage gain of the trend. The label can be dragged to a more
convenient place if you like.
Right-clicking on the trend label brings up several options.
 Font - Changes the label's font.
Remove - Delete the label.
Text - Change the label's text. |
Trend Line Thickness (Width) (Width)
The
Appearance Dialog has settings for the trend
line width. Set the width before drawing the trend.
Removing Trend lines 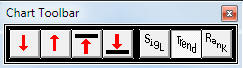
Be sure that the Trend Button is pressed. The shading is slight, but
you can click and unclick several times to ensure that you can tell the
difference.
Double-click beneath the trend line to select it (the line will turn dashed instead of
solid) and then hit the <Delete> key on your keyboard. The double-click will always
select the trend line above the cursor.
To get rid of all trends. Right-click on the Chart toolbox and select
Trend/Clear.
Trend Saving
Right-click on the chart and select Save/trend lines . Trends are saved in
a file under a name you specify.
C:\FT\FT4WIN\TRENDS\USERDEF\MyName.TRN
Displayed trends will be saved when you shut down FT4WEB to the file,
C:\FT\FT4Win\TRENDS\DEFAULT.TRN. On restarting FT4WEB, the DEFAULT trends
are drawn. Remove the trend lines before shutdown to clear the DEFAULT. Trends can be loaded again later by right-clicking the chart and
selecting Load/trend lines .
|