Introducing Morningstar Indexes
Last updated 06/12/2014
- Overview of Morningstar Indexes. What are they?
- Review of trading opportunities. What can I do with them?
- Comparison of Morningstar Style Indexes with S&P Indexes.
- Modeling to maintain a diversified, high performing portfolio. How do I choose among the16 indexes?
- What do I do Today? What should I buy or Sell?
- But I can't invest in the Indexes! What Mutual Funds should I use to approximate the Indexes?
Overview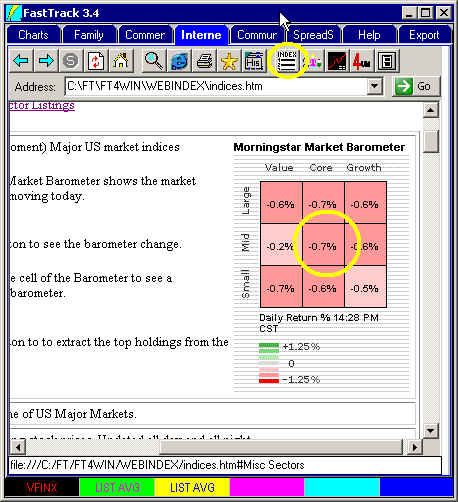
In the July 2002, Morningstar, a well-known source of mutual fund and stock fundamental data, introduced 16 style indexes in dividend-adjusted and nonadjusted versions. These indexes reflect the Morningstar's style and market cap mutual fund characterizations of individual stocks. FastTrack carries the 16 total return indexes adjusted for dividends, spinoffs, mergers, and other corporate actions.
According to Morningstar, each stock is placed into one, and only one, index. Those which clearly fit Morningstar growth and value styles are placed in the appropriate index. Where the style is unclear, the stock is placed in one of the all-style, core indexes.
Morningstar says its indexes were "designed to support investment creation from the beginning. Comprising the best practices in index construction—broad market representation, investability, and controlled turnover—the indexes are a sound basis for index mutual funds, exchange traded mutual funds and derivative products."
For details on the indexes including holdings:
- Click FT4Web's Internet Tab
- Click the Index button (upper yellow circle)
- Click any of the 9 squares (lower yellow circle) in the Morningstar Market Barometer to learn about the index represented by that square.
FastTrack testing of the indexes shows surprisingly good results. These indexes offer variety and ample opportunity to make a few trades per year to take advantage of rotation between major market segments. Morningstar has done a good job clearly defining US market's. FastTrack looks forward to these indexes becoming available as mutual funds.
 Trading Opportunity?
Eleven of the indexes have a high correlation with the S&P 500 represented by VFINX. This is not optimal for sector rotation trading.
However, there is a wide range of monthly standard deviation from a high of 9.12% to 4.61%, Thus, there is opportunity to trade accelerating trends.
There are 5 mutual funds that are not highly correlated with VFINX. Five low correlation mutual funds should provide adequate rotation opportunities to trade.
Classic FastTracking
From inception in 1989, FastTrack has suggested using AccuTrack 12 48 for trading,
- large vs small cap mutual funds
- growth vs value mutual funds.
The two Morningstar indexes with the extreme high and low Standard Deviations happen to be Large Growth and Small Value, a combination which should produce strongly tradable characteristics.
 Results
- Moderate risk, SD=6.55
- High annualized return, Ann=22.29%
- Switches/year, S/Y=1.6
- A Growth and Value mutual fund manager might lead his mutual fund class trading Morningstar indexes with AccuTrack.
The lower chart shows a red/green composite line which show the impact of trading between the red and green in the upper chart. The composite line traces the real return of switching 100% of assets at each indicator signal..
More Classic AccuTrack
 The next two indexes most widely separated by SD are MidCap Growth and
MidCap Value.
The next two indexes most widely separated by SD are MidCap Growth and
MidCap Value.
Using the same AccuTrack parameters above produces
- Moderate risk, SD=6.50
- High annualized return, Ann=14.82%
- Switches/year, S/Y= 2.1
It appears that
- Morningstar has a very strong, pure growth vs value algorithm which would create a highly tradable ETF.
- A MidCap mutual fund manager might lead his sector using Morningstar models and shifting his growth values monthly.
 Even More
Trading the AllCap Growth and Value indexes produces attractive results.
What is impressive about these Morningstar indexes is their consistency in maintaining the unique character of each index over long periods.
 Competitive Analysis
S&P authors Morningstar- like style indexes. Among these are NJG-X and NJS-X. These are directly comparable to $MLGR and $MSVL.
Notice the paired similarity of the yellow and red lines, and the purple and green lines.
The significant point is that the highest and lowest indexes are the Morningstar indexes. They have Standard Deviations (SD=) of 5.29 and 10.29 making the two substantially dissimilar, and a good trading pair.
The S&P Indexes have SD= 6.46 and 5.29 . . .much more closely
matched than the Morningstar Indexes making them a poor trading pair.
Further, the Morningstar Indexes have a low correlation (Cor=) of 62.47% to each other. S&P Indexes had a Cor= 80.5% (not shown). Low correlation pairs trade better than high correlation pairs.
Visually correlation and Standard Deviation differences between S&P and Morningstar are subtle, but they make a BIG difference in the profitability of relative strength trading.
Modeling
- The red line is the Momentum model.
- The green is VFINX for comparison.
- The yellow is a non-momentum, monthly rebalanced average. Each month assets are divided equally among all indexes
- The lower chart is relative strength. When the lines go up, then the red line is beating the green line.
Not surprisingly, holding all indexes equally weighted (yellow) produces returns highly correlated to and of same volatility as the VFINX index mutual fund. . . . Don't over diversify by holding many Morningstar Index mutual funds! Just buy a single S&P Index mutual fund.
 To
avoid the over diversification problem, use the FastTrack Momentum model. In the
chart above, the Momentum Model (red line) produces S&P beating
performance from 1999-present. In the early years (pre 6/30/1997) only four of
the 16 indexes had data. These long-term indexes were the All Style Indexes (highlighted in the list to the right). They had and still have very high
correlation to the S&P 500. This means there was, and still is, no value in trading
among them. You include the other noncorrelated and different Volatility indexes.
To
avoid the over diversification problem, use the FastTrack Momentum model. In the
chart above, the Momentum Model (red line) produces S&P beating
performance from 1999-present. In the early years (pre 6/30/1997) only four of
the 16 indexes had data. These long-term indexes were the All Style Indexes (highlighted in the list to the right). They had and still have very high
correlation to the S&P 500. This means there was, and still is, no value in trading
among them. You include the other noncorrelated and different Volatility indexes.
The lower chart is FastTrack's relative strength chart. Its lines go up when the red line outperforms the green line. It shows that red line underperformance was especially strong for the period 1994-1999 which was the era of the S&P Index mutual fund . . . NOTHING beat the S&P 500 for this period.
Things changed in late 1999. Indexes populated with technology soared. After the 2000 market top, the value indexes held up especially well. Since the spring of 2003, the model has shifted out of value. The relative strength chart shows a sharp upturn with the red line model besting the green S&P mutual fund.
What to do Today
 This spreadsheet includes the NCAlpha Column. Click
for NCAlpha details. The green line (unseen) is the red
line from the big chart above.
This spreadsheet includes the NCAlpha Column. Click
for NCAlpha details. The green line (unseen) is the red
line from the big chart above.
Indexes with positive NCAlpha values have been helping the portfolio by increasing return and reducing the volatility of the portfolio since the beginning of the year. Overweight them.
Those with negative NCAlpha are hurting the return and volatility. Underweight them.